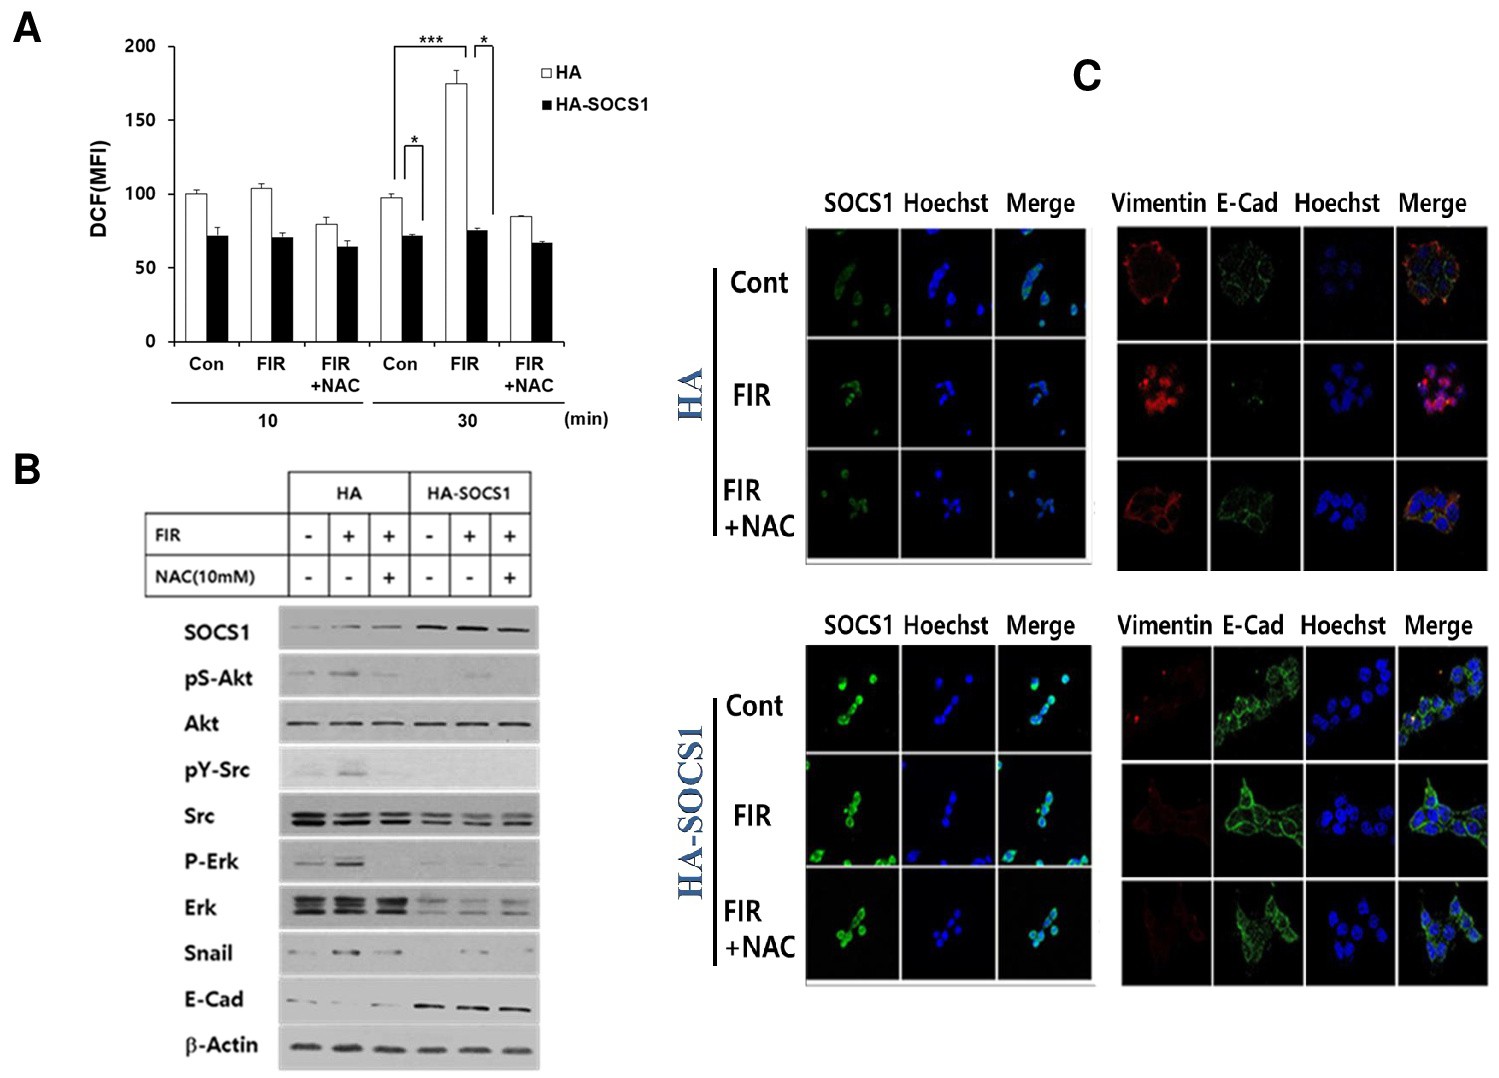
Fig. 3. SOCS1 over-expressing cells exhibited dampened response to FIR in ROS and EMT induction. HCT116 p53+/+ cells transfected with pcDNA/HA-SOCS1 (HA-SOCS1) or mock (HA) cells received FIR in the presence or absence of NAC. (A) Intracellular ROS levels were determined by FACS analysis. Results show representative data of independent experiments performed in triplicate wells (*, p ≤ 0.05; ***, p ≤ 0.005). (B) The cells treated above were analyzed for the expression levels of EMT markers and signaling molecules by Western blot. The densitometric analysis data are shown in Fig. S5. (C) Immunofluorescence staining was performed as described in the text to show the expression of SOCS, vimentin and E-cadherin levels in mock (HA) vs HA-SOCS1 cells.